My current role sees me as a principal engineer, but in previous roles, I’ve also been a ScrumMaster and try as I might, I can’t quite throw off that ScrumMaster mindset.
Recently I’ve been looking at our Scrum process, and it seems that since the transition of our final team to Jira, we’re getting good data out of our teams, but unless you attend a retrospective, it’s a little hidden.
Looking at the tools of Scrum, there is the concept of information radiators. These are events or displays (not necessarily even electronic), that are able to present information with minimal effort. Having the Scrum board up at our daily stand-ups are a good example of this.
I also noticed that Jira has a Wallboards feature, which takes graphs that are usually created for retrospectives, and allows the data to be cycled through via a browser. This sounds like a great tool for an information radiator.
Creating the Wallboard
It turns out it’s actually quite simple to create a Wallboard in Jira.
First you need to create a Dashboard. This is a drag-drop canvas of widgets that link up to your data source.
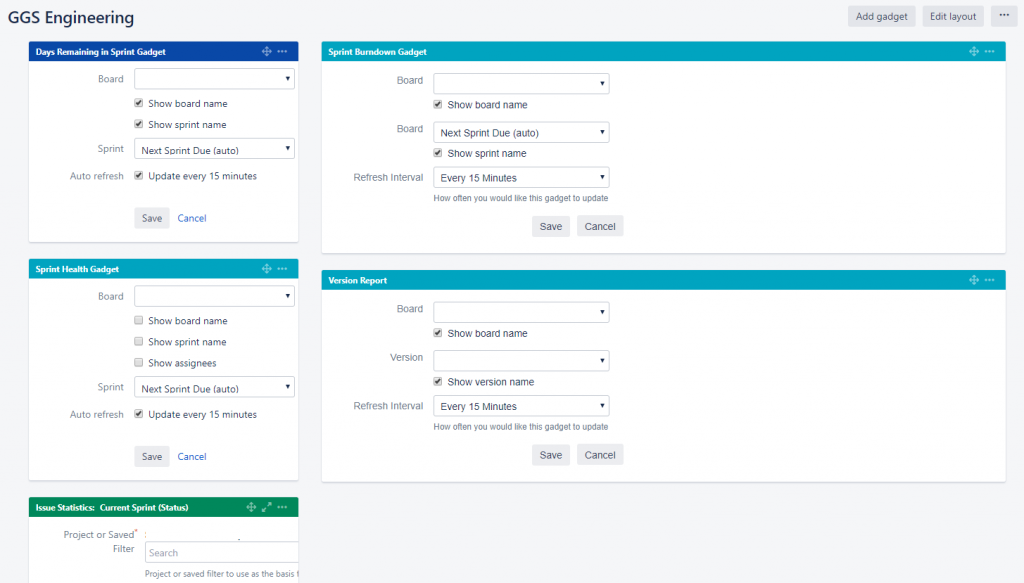
Adding widgets to a Jira dashboard.
You can have a number of different layouts, but this is where is starts to get a little tricky, if you haven’t read all the documentation (which we always do, right?). Some layouts contain columns, which is useful, but if you just add your widgets, thinking it’ll use the space in the column before cycling, you’d be wrong.
The color of the title bar of your widget is actually important. It turns out that it actually uses the color to set a cycle slot. This means that in our display above, since the gadgets on the left hand side are all in different colors, they’ll set their own cycle slot, meaning that they’ll all be on the same page. The gadgets on the right hand side, however, are the same color, meaning that they’ll cycle between each other.
Once your dashboard is complete, it’s easy to create a wallboard from it. Simply select the wallboard option in the menu on the right hand side of your dashboard.
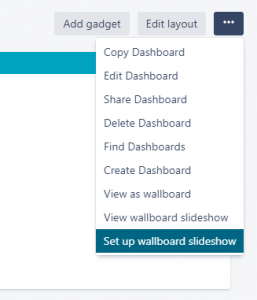
Creating a Wallboard from a Dashboard
Once that is done, you should end up with a nice display, transitioning through your cycle slots.
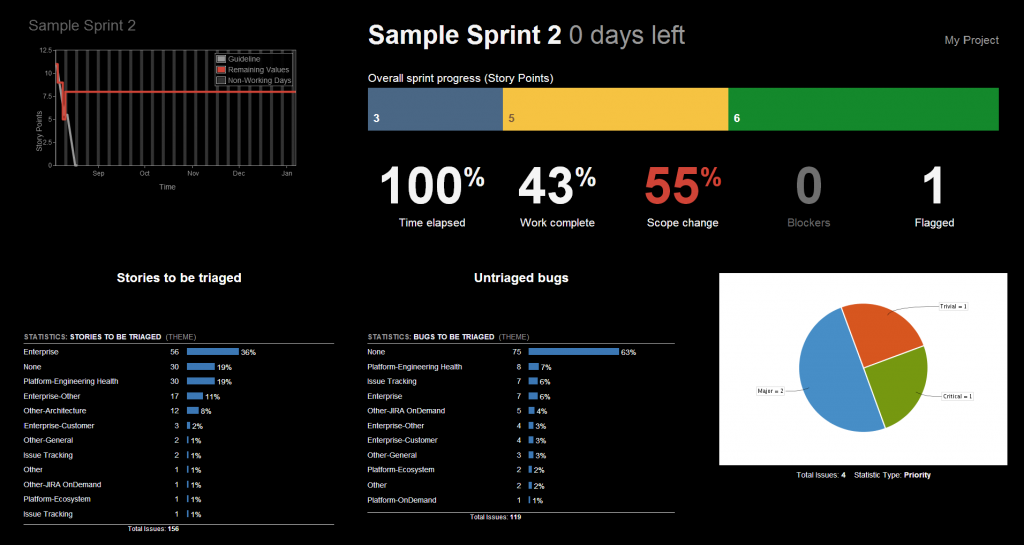
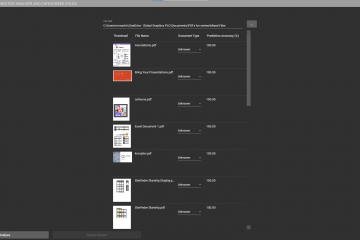
An example wallboard.
Further Work
Next, I’m going to get a Raspberry Pi, which can run the Wallboard in a browser, hooked up to a monitor. This monitor can then stand in a high traffic area, displaying our data for all to see. Nice!